On TikTok, the hour you post made no measurable difference to views: across 32,657 videos from 977 public accounts, every three-hour block of the day landed within 4% of the same accounts' other videos, and none was clearly better or worse. Sunday was the one day that stood out, with 4% more views. What you post mattered more than when: videos over three minutes got 14% more views, and photo posts got 11% fewer.
We measured this on a fixed panel of public accounts, from 1,000-follower creators to accounts with tens of millions of followers, across 19 niches. Each video is compared with the other videos from the same account, so a huge account can't make its favourite posting hour look good just by being huge. The method, the limits and the full tables are below, and you can download the aggregate data.
The heatmap
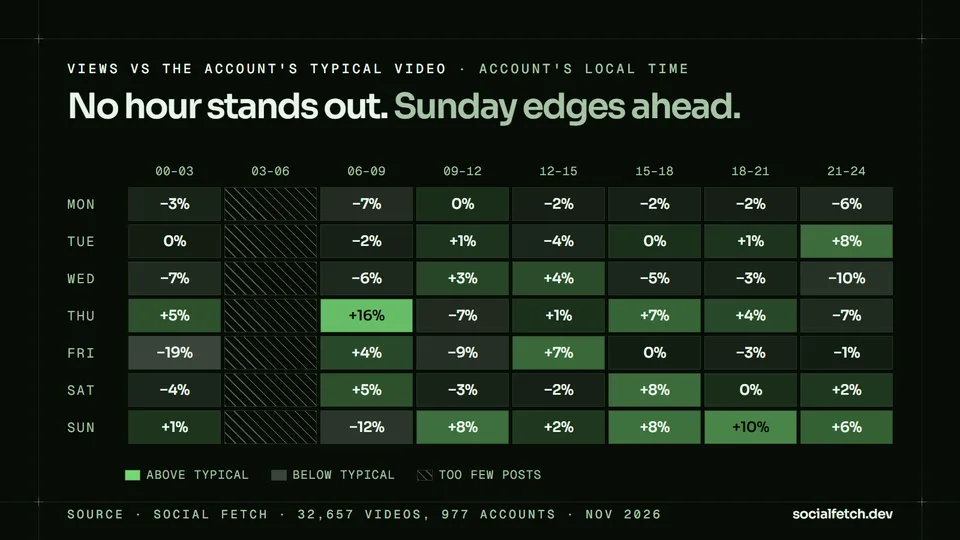
Read it as "videos posted in this slot got this much more or fewer views than the same accounts' other videos." Unlike Instagram, there's no column that stands out: the strong cells are scattered, and most cells hold a few hundred videos with intervals 14 to 25 points wide. Three in five cells are within 5% of typical. The one pattern that holds across the week is the bottom row: Sunday is above typical in most blocks.
By time of day
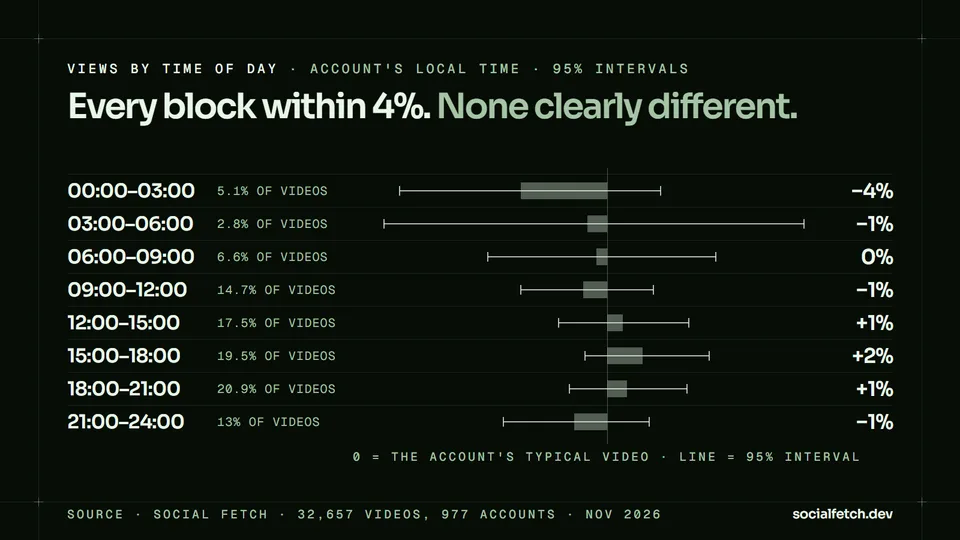
| Local time | Views vs typical | 95% interval | Videos | Accounts | Share of videos |
|---|---|---|---|---|---|
| 00:00–03:00 | −3.9% | −9.4% to +2.4% | 1,517 | 349 | 5.1% |
| 03:00–06:00 | −0.9% | −10.1% to +8.9% | 845 | 206 | 2.8% |
| 06:00–09:00 | −0.5% | −5.4% to +4.9% | 1,969 | 398 | 6.6% |
| 09:00–12:00 | −1.1% | −3.9% to +2.1% | 4,394 | 695 | 14.7% |
| 12:00–15:00 | +0.7% | −2.2% to +3.7% | 5,232 | 751 | 17.5% |
| 15:00–18:00 | +1.6% | −1.0% to +4.6% | 5,821 | 748 | 19.5% |
| 18:00–21:00 | +0.9% | −1.7% to +3.6% | 6,254 | 757 | 20.9% |
| 21:00–24:00 | −1.5% | −4.7% to +1.9% | 3,882 | 636 | 13.0% |
Every interval includes zero. Afternoon and early evening (noon to 9pm) are a point or two above typical and the small hours a few points below, but the differences are smaller than the noise. The same holds for likes and comments, and hour by hour: no single hour's interval excludes zero either.
On single-time-zone countries only, 3pm to 6pm came out at +4.9% (interval +0.6% to +9.5%, 2,158 videos), the one block that cleared zero in that check. If you want one slot to try, that's it, but it's a weak signal.
By day of the week
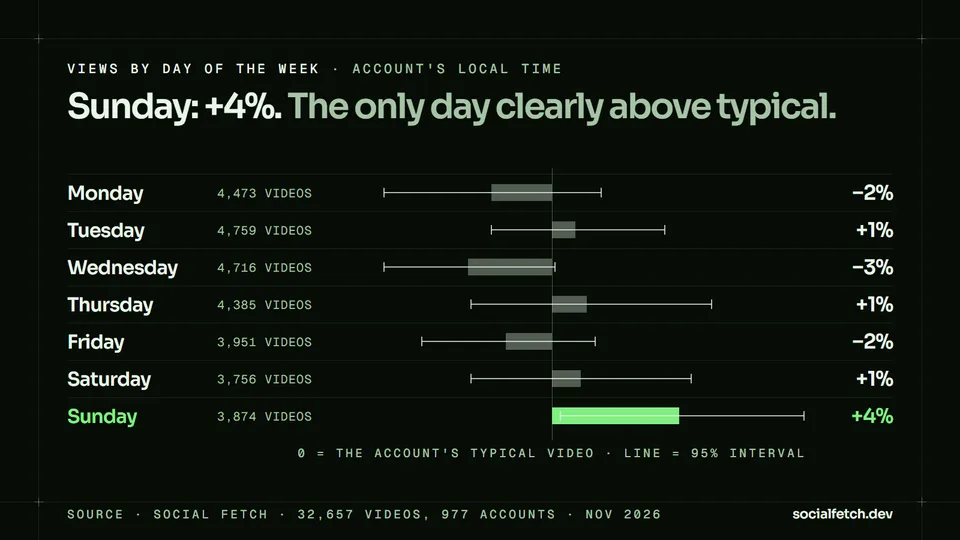
| Day (local time) | Views vs typical | 95% interval | Videos | Accounts |
|---|---|---|---|---|
| Monday | −2.1% | −5.8% to +1.7% | 4,473 | 849 |
| Tuesday | +0.8% | −2.1% to +3.9% | 4,759 | 865 |
| Wednesday | −2.9% | −5.8% to +0.1% | 4,716 | 858 |
| Thursday | +1.2% | −2.8% to +5.5% | 4,385 | 844 |
| Friday | −1.6% | −4.5% to +1.5% | 3,951 | 828 |
| Saturday | +1.0% | −2.8% to +4.8% | 3,756 | 801 |
| Sunday | +4.4% | +0.3% to +8.7% | 3,874 | 799 |
Sunday is the only day whose interval sits above zero, and it's the least-used day: 13% of videos against 14% for an even spread. Likes and comments show the same Sunday gain (+4.3%, interval +0.4% to +8.4%).
Length and format matter more
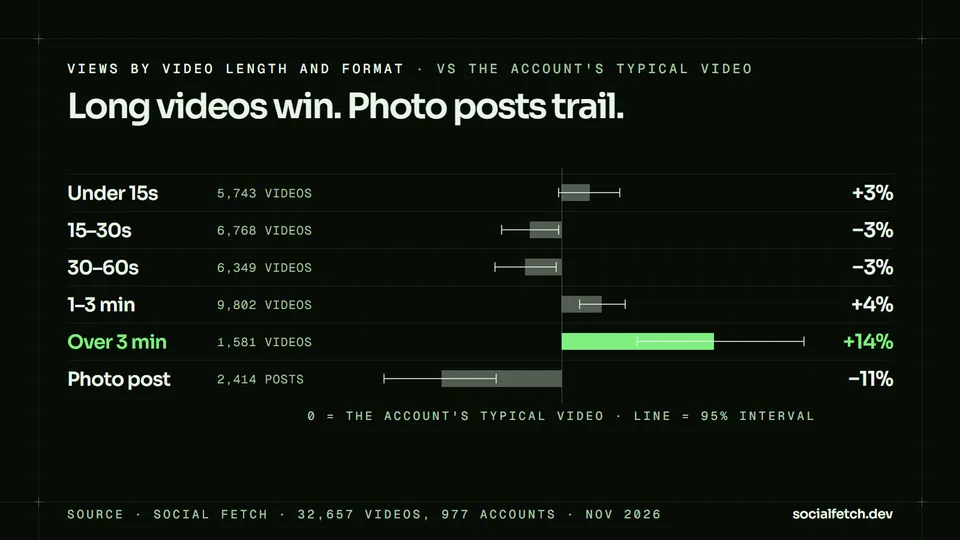
| Post | Views vs typical | 95% interval | Videos | Accounts |
|---|---|---|---|---|
| Video under 15s | +2.5% | −0.3% to +5.2% | 5,743 | 662 |
| Video 15–30s | −2.9% | −5.4% to −0.3% | 6,768 | 756 |
| Video 30–60s | −3.3% | −6.0% to −0.5% | 6,349 | 763 |
| Video 1–3 min | +3.6% | +1.6% to +5.7% | 9,802 | 731 |
| Video over 3 min | +13.7% | +6.8% to +21.8% | 1,581 | 235 |
| Photo post | −10.8% | −16.0% to −5.9% | 2,414 | 376 |
The gap between a three-minute video and a 30-second one from the same account (18%) is three times the gap between the best and worst time of day. Longer videos also hold viewers longer, and TikTok has pushed longer uploads, so this may partly reflect what the feed rewards rather than the videos themselves.
Photo posts (swipeable image posts) did worse the bigger the account: −1% for accounts under 10k followers, −7% for 10k to 100k, −19% for 100k to 1M and −28% for 1M to 10M.
By account size
| Followers | 06:00–09:00 | 09:00–12:00 | 12:00–15:00 | 15:00–18:00 | 18:00–21:00 | 21:00–24:00 |
|---|---|---|---|---|---|---|
| Nano, 1k–10k | +2.3% | −1.0% | +2.7% | −1.8% | +2.1% | −3.4% |
| Micro, 10k–100k | +0.4% | −3.3% | +4.6% | +3.7% | −0.1% | +0.6% |
| Mid, 100k–1M | +0.2% | +0.7% | +1.2% | +2.4% | 0.0% | −4.8% |
| Macro, 1M–10M | −3.9% | −0.8% | −4.2% | +1.8% | +1.6% | +1.1% |
No tier shows a time-of-day pattern either: every cell is within 5% of typical, and the best block differs from tier to tier. Accounts over 10 million followers aren't in this table: only 25 of them posted enough in the window, too few to split by time.
How we measured this
Sample. We searched TikTok's user search for six queries in each of 19 niches (fitness, food, travel, fashion, beauty, tech, business, photography, art, music, sports, parenting, pets, gaming, home, science, cars, entertainment and news), three pages each, which found 6,475 public accounts with their follower counts. From those we drew accounts at random with a fixed seed, in two rounds of 12 and then 18 per niche and tier, across five follower tiers: nano (1,000–10,000), micro (10,000–100,000), mid (100,000–1 million), macro (1–10 million) and mega (over 10 million). Search finds few mega accounts, so five well-known accounts per niche topped that tier up. The panel had 1,699 accounts.
Videos. For each account we read up to five pages of its videos (10 a page) and kept videos that were between 7 and 180 days old (younger videos are still collecting views), posted by the account itself, not pinned and not ads. Many accounts that search finds have stopped posting: 1,142 of the 1,699 posted in the window. Accounts with fewer than 8 videos were dropped. That left 32,657 videos from 977 accounts, posted between 23 May and 12 November 2026 and collected on 19 November 2026: 30,243 videos and 2,414 photo posts.
Local time. Each TikTok video carries a region code. We took each account's most common region and converted each video's time to that country's time zone, using the most populous zone for countries with several (Eastern Time for the United States, for example). 895 accounts and 29,914 videos have a region we could map; the rest are left out of the local-time tables.
Views. TikTok reports a view count on every video, and reach is what posting times are meant to help with, so views are the main measure. Likes plus comments are checked alongside and show the same pattern.
Formula. For each video, we took the log of (views + 1) and subtracted the average of that value over all the account's videos in the sample. Zero means the account's typical video. A group of videos (an hour, a day, a length) gets the mean of those scores, converted back to a percentage: exp(mean) − 1. This compares every account with itself, so a 20-million-follower account counts the same as a 2,000-follower one.
Intervals. 95% intervals come from a bootstrap that resamples accounts rather than videos (1,000 replicates), because videos from one account aren't independent. A cell with fewer than 150 videos or 40 accounts is marked as too thin to report.
The API calls, and running it yourself
Every number here came from two Social Fetch API endpoints, the same ones you can call with your own key. The study used 5,951 credits.
Find accounts:
GET /v1/tiktok/users/searchreturns 30 accounts a page for a search query, each with its follower count (1 credit a page).Videos:
GET /v1/tiktok/profiles/{handle}/videospages through an account's videos, 10 at a time, with each video's time, length, views, likes, comments, shares and saves, plus the account's follower count and region (1 credit a page).
Each item in data.videos has createdAt (UTC), durationMs, pinned and stats.views, stats.likes and stats.comments. Pass data.page.nextCursor as cursor for the next page.
To find your own best time, run best-time-to-post.mjs on your account and a few competitors. It uses the same rules and the same per-account scoring as this study, and prints each three-hour block and each day in your time zone. It needs Node 18 or later and nothing else:
Three accounts with five pages each cost at most 15 credits. A handful of accounts gives you a direction, not a measurement: the study needed hundreds of accounts to get its intervals down to a few points.
What this can't tell you
Views are what TikTok shows publicly. We can't see watch time, completion rate or where views came from (For You, following, search).
It's correlation within accounts, not an experiment. Accounts choose when to post and how long to make a video. If people post their best work on Sundays, Sunday looks better for that reason.
Local time comes from the region on the account's videos. For the United States, Canada, Mexico, Brazil, Australia and other multi-zone countries we used one zone, so a Los Angeles account's 6pm counts as 9pm.
The biggest accounts are thin. Only 25 accounts with over 10 million followers posted enough in the window. They're 25 of 977 accounts, too few to move the overall results much, and too few to report on their own.
The panel leans American. 462 of the 977 accounts are based in the United States, 61 in the United Kingdom and 42 in Pakistan.
Your audience is not the average. Your own analytics, if you have enough videos, beat any study.
It's a snapshot. Videos from May to November 2026; TikTok's feed changes.
Download the data
The aggregate tables behind this post, under CC BY 4.0 (credit "Social Fetch" with a link to this page). They contain no account names, handles or individual videos.
Weekday × hour, local time (CSV): 168 cells.
Weekday × three-hour block, local time (CSV): the heatmap above.
By hour, by weekday, by length, by format, likes and comments by block and by tier and block (CSV).
Each row has the change in views in percent, its 95% interval, the number of videos and accounts, and a thin flag.
For Instagram, where timing does matter a little, see the best time to post on Instagram.
FAQ

The Social Fetch data team builds the numbers on our data pages and studies, with the same public API our customers use, so every number comes with the request that produced it.
Related articles

Questions about this post? Contact us.