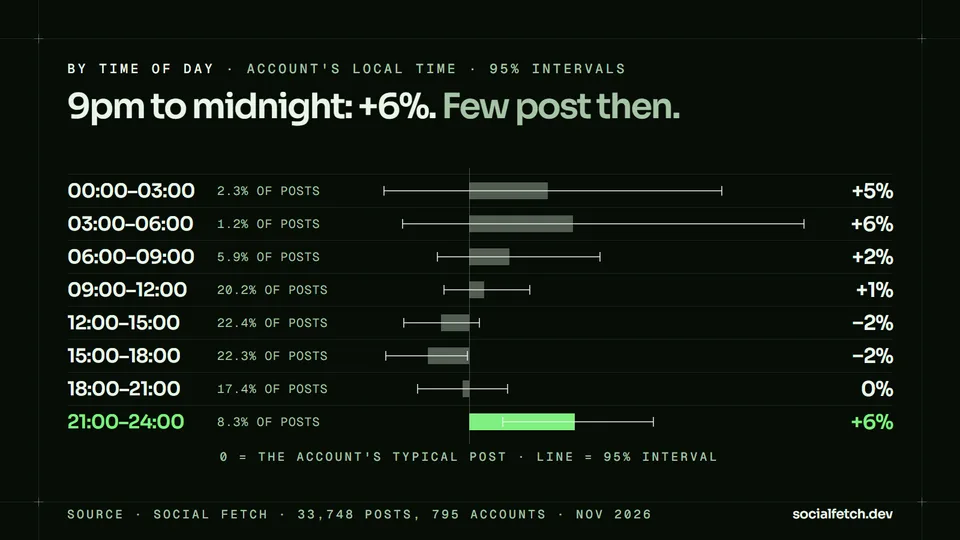
Instagram posts published between 9pm and midnight local time got 6% more likes and comments than the same accounts' other posts, in our study of 33,748 posts from 795 public accounts, yet only 8% of posts go out in that window. Every other three-hour block from 6am to 9pm landed within 3% of an account's typical post. The format of a post moved engagement more than the hour did: carousels got 14% more than single photos.
We measured this on a fixed panel of public accounts, from 1,000-follower hobby accounts to 100-million-follower brands, across 19 niches. Each post is compared with the other posts from the same account, so a big account can't make its favourite posting hour look good just by being big. The method, the limits and the full tables are below, and you can download the aggregate data.
The heatmap
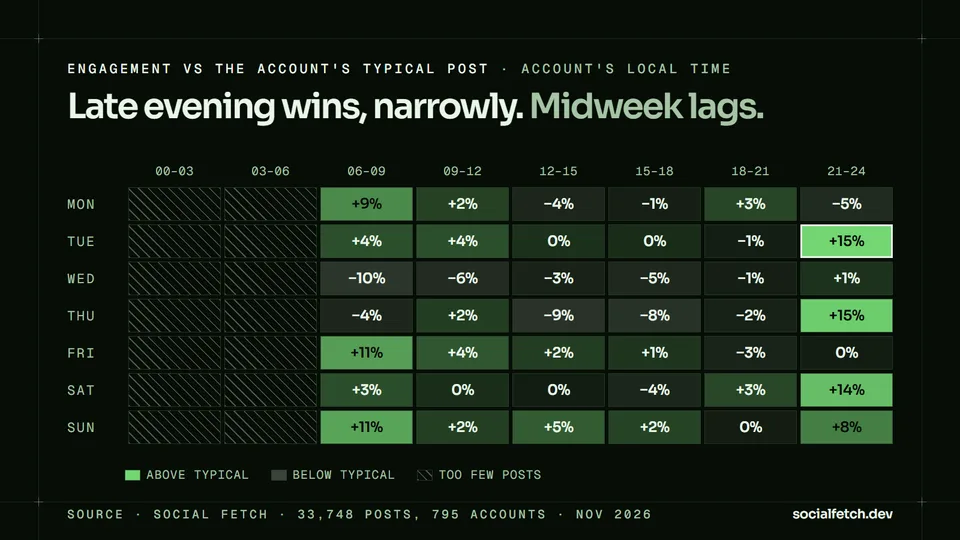
Read it as "posts in this slot did this much better or worse than the same accounts' other posts." The strongest cells all sit in the last column, 9pm to midnight. The weakest run across Wednesday and Thursday daytime. Most cells are within 5% either way, which is the main finding: for most hours of most days, the time you post makes little difference.
Single cells are noisy. A weekday and three-hour block holds 180 to 1,330 posts, and most of their 95% intervals are 10 to 20 points wide, so treat one cell's number as a direction rather than a measurement. The tables below pool the days, which narrows the intervals.
By time of day
| Local time | Engagement vs typical | 95% interval | Posts | Accounts | Share of posts |
|---|---|---|---|---|---|
| 00:00–03:00 | +4.7% | −5.1% to +15.1% | 713 | 208 | 2.3% |
| 03:00–06:00 | +6.2% | −4.0% to +20.0% | 377 | 114 | 1.2% |
| 06:00–09:00 | +2.4% | −1.9% to +7.8% | 1,848 | 350 | 5.9% |
| 09:00–12:00 | +0.9% | −1.5% to +3.6% | 6,347 | 650 | 20.2% |
| 12:00–15:00 | −1.7% | −3.9% to +0.6% | 7,011 | 672 | 22.4% |
| 15:00–18:00 | −2.5% | −5.0% to −0.1% | 7,004 | 682 | 22.3% |
| 18:00–21:00 | −0.4% | −3.1% to +2.3% | 5,442 | 613 | 17.4% |
| 21:00–24:00 | +6.3% | +2.0% to +11.0% | 2,617 | 420 | 8.3% |
Two blocks have intervals that don't cross zero: 9pm to midnight, above typical, and 3pm to 6pm, just below. The overnight blocks also look good, but they hold so few posts that their intervals run from below zero to +15% or more.
Nearly two thirds of posts (65%) go out between 9am and 6pm, the hours that did no better than average. Our data can't say why the late-evening posts do better. One plausible reason is less competition: fewer posts are published then, while people are still scrolling.
By single hour, 10pm was the strongest well-sampled hour at +13% (interval +5% to +24%, 977 posts) and 3pm the weakest at −6% (−10% to −3%, 2,335 posts). Hourly cells are smaller, so use the three-hour blocks for planning.
By day of the week
| Day (local time) | Engagement vs typical | 95% interval | Posts | Accounts |
|---|---|---|---|---|
| Monday | −0.1% | −3.1% to +2.8% | 4,772 | 704 |
| Tuesday | +2.6% | −0.2% to +5.7% | 5,108 | 709 |
| Wednesday | −3.3% | −5.7% to −0.7% | 5,361 | 717 |
| Thursday | −3.2% | −5.8% to −0.2% | 4,746 | 695 |
| Friday | +2.0% | −1.2% to +5.4% | 4,681 | 695 |
| Saturday | +0.4% | −3.6% to +4.4% | 3,382 | 628 |
| Sunday | +3.1% | −0.7% to +6.8% | 3,309 | 601 |
The day matters even less than the hour. Wednesday and Thursday came out about 3% below typical, and no day was clearly above it. Weekends carry fewer posts (21% of the sample against 29% for an even spread) without doing worse.
Format matters more than timing
| Format | Engagement vs typical | 95% interval | Posts | Accounts |
|---|---|---|---|---|
| Carousels | +4.8% | +2.1% to +7.3% | 11,888 | 706 |
| Reels | +0.2% | −2.0% to +2.8% | 15,188 | 735 |
| Single photos | −8.4% | −12.3% to −5.2% | 6,672 | 575 |
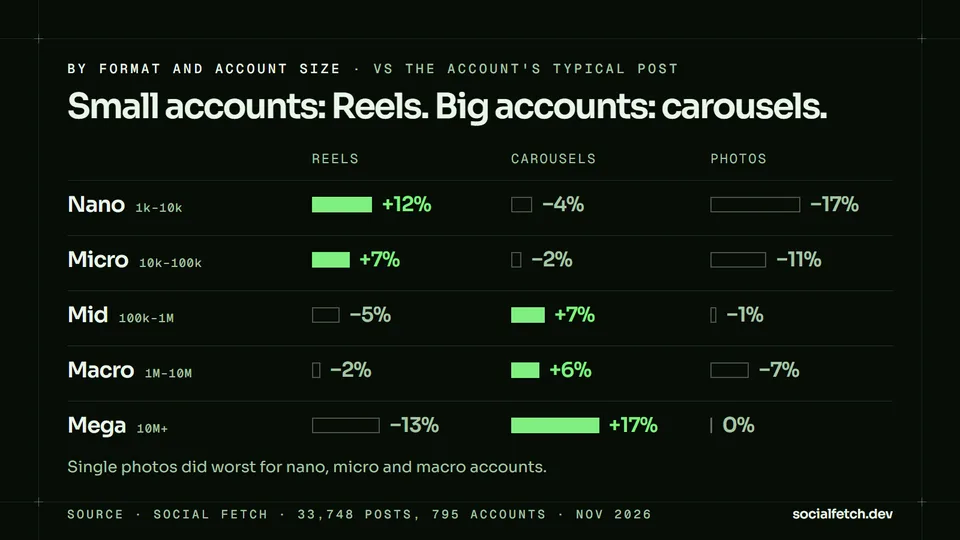
Across all accounts, carousels got 14% more likes and comments than single photos from the same accounts. That gap is bigger than the gap between the best and worst time of day.
The best format depends on account size:
| Followers | Reels | Carousels | Single photos |
|---|---|---|---|
| Nano, 1k–10k | +11.7% | −4.1% | −17.5% |
| Micro, 10k–100k | +7.3% | −2.0% | −10.9% |
| Mid, 100k–1M | −5.4% | +6.5% | −1.2% |
| Macro, 1M–10M | −1.6% | +5.5% | −7.5% |
| Mega, 10M+ | −13.2% | +17.1% | +0.4% |
For accounts under 10k followers, a Reel got 35% more likes and comments than a single photo from the same account (20% more for accounts with 10k to 100k). For accounts over 10 million, a carousel got 35% more than a Reel. Likes and comments aren't the whole story for Reels, which also earn plays, shares and saves; if your goal is reach rather than likes, the Reel numbers here understate them.
By account size
The 9pm-to-midnight block is above typical in every tier, by more for bigger accounts, though the per-tier samples are smaller:
| Followers | 06:00–09:00 | 09:00–12:00 | 12:00–15:00 | 15:00–18:00 | 18:00–21:00 | 21:00–24:00 |
|---|---|---|---|---|---|---|
| Nano, 1k–10k | −2.3% | +1.2% | −0.3% | +1.3% | −1.6% | +1.4% |
| Micro, 10k–100k | −5.5% | +2.2% | −2.1% | −2.4% | +2.3% | +6.9% |
| Mid, 100k–1M | +5.6% | −2.4% | −0.4% | −1.5% | −2.0% | +4.7% |
| Macro, 1M–10M | +9.8% | −2.1% | −1.8% | −2.0% | +4.2% | +6.3% |
| Mega, 10M+ | +15.9% | +8.9% | −4.1% | −9.4% | −6.3% | +15.3% |
For nano accounts, timing made almost no difference at all: every block is within 2.5% of typical. The bigger the account, the bigger the swing, and the more early morning and late evening beat the afternoon. Each tier's cells hold 170 to 1,900 posts, so read this table for its shape, not its exact values.
How we measured this
Sample. A panel of 1,071 public Instagram accounts, drawn at random with a fixed seed from 20,373 candidates, with up to 12 accounts for each of 19 niches (fitness, food, travel, fashion, beauty, tech, business, photography, art, music, sports, parenting, pets, gaming, home, science, cars, entertainment and news) in each of five follower tiers: nano (1,000–10,000), micro (10,000–100,000), mid (100,000–1 million), macro (1–10 million) and mega (over 10 million). Mega accounts are scarcer, so that tier has 159 rather than 228. Candidates came from Instagram's own "similar accounts" suggestions, starting from five well-known accounts per niche and repeated from the smallest accounts found, so the panel reaches 1,000-follower accounts that search results and trending lists never show.
Posts. For each account we read up to six pages of its profile grid and kept posts that were between 7 and 180 days old (younger posts are still collecting likes), posted by the account itself, not pinned, and showing their like count. Accounts with fewer than 8 such posts were dropped. That left 33,748 posts from 795 accounts, published between 23 May and 11 November 2026, and collected on 18 November 2026: 15,188 Reels, 11,888 carousels and 6,672 single photos.
Local time. Instagram's "About this account" panel says which country an account is based in. We converted each post's time to that country's time zone, using the most populous zone for countries with several (Eastern Time for the United States, for example). 735 accounts and 31,359 posts have a country; the rest are left out of the local-time tables. Rerun on single-time-zone countries only, the 9pm to midnight block comes out at +8.8% (+2.7% to +15.8%, 1,413 posts), so the result doesn't come from the time-zone shortcut.
Engagement. Likes plus comments. Every format has both; plays exist only for Reels.
Formula. For each post, we took the log of (engagement + 1) and subtracted the average of that value over all the account's posts in the sample. Zero means the account's typical post. A group of posts (an hour, a day, a format) gets the mean of those scores, converted back to a percentage: exp(mean) − 1. This compares every account with itself, so a 100-million-follower account counts the same as a 2,000-follower one.
Intervals. 95% intervals come from a bootstrap that resamples accounts rather than posts (1,000 replicates), because posts from one account aren't independent. A cell with fewer than 150 posts or 40 accounts is marked as too thin to report.
The API calls, and running it yourself
Every number here came from three Social Fetch API endpoints, the same ones you can call with your own key. The study used 15,713 credits.
Find accounts:
GET /v2/instagram/profiles/{profile}/similarlists the accounts Instagram suggests as similar to one you give it (1 credit).Follower count and country:
GET /v2/instagram/profiles/{profile}?include=aboutreturns the profile with its "About this account" panel (2 credits).Posts:
GET /v2/instagram/profiles/{profile}/mediapages through the profile grid, with each post's time, format, likes, comments and plays (1 credit a page).
Each item in data.media has createdAt (UTC), mediaType (image, video or carousel), metrics.likeCount, metrics.commentCount and metrics.playCount. Pass data.page.nextCursor as cursor for the next page.
To find your own best time, run best-time-to-post.mjs on your account and a few competitors. It uses the same rules and the same per-account scoring as this study, and prints each three-hour block in your time zone. It needs Node 18 or later and nothing else:
Three accounts with three pages each cost 9 credits. A handful of accounts gives you a direction, not a measurement: the study needed hundreds of accounts to get its intervals down to a few points.
What this can't tell you
It measures likes and comments, not reach. Instagram doesn't show reach or impressions publicly. A post can reach more people without getting more likes.
It's correlation within accounts, not an experiment. Accounts choose when to post. If people save their best content for the evening, the evening looks better for that reason. Comparing each account with itself removes differences between accounts, not choices within one.
Local time is inferred from country. For the United States, Canada, Brazil, Australia and other multi-zone countries we used one zone, so a Los Angeles account's 7pm counts as 10pm. The single-zone check above suggests this doesn't change the answer, but it blurs the hourly numbers.
Overnight is thin. Fewer than 4% of posts go out between midnight and 6am, so we can't say whether those hours are good.
The panel leans American and English-speaking. 383 of the 795 accounts are based in the United States and 74 in the United Kingdom. Audiences elsewhere may behave differently.
Your audience is not the average. These are averages over 795 accounts. Your own analytics, if you have enough posts, beat any study.
It's a snapshot. Posts from May to November 2026; Instagram's ranking changes.
Download the data
The aggregate tables behind this post, under CC BY 4.0 (credit "Social Fetch" with a link to this page). They contain no account names, handles or individual posts.
Weekday × hour, local time (CSV): 168 cells.
Weekday × three-hour block, local time (CSV): the heatmap above.
By hour, by weekday, by format and by tier and block (CSV).
Each row has the engagement change in percent, its 95% interval, the number of posts and accounts, and a thin flag.
FAQ

The Social Fetch data team builds the numbers on our data pages and studies, with the same public API our customers use, so every number comes with the request that produced it.
Related articles
Questions about this post? Contact us.